Prometheus 集成
该功能支持集成 Prometheus 以监控 ClickHouse Cloud 服务。Prometheus 指标的访问通过 ClickHouse Cloud API 端点公开,该端点允许用户安全地连接并将指标导出到他们的 Prometheus 指标收集器中。这些指标可以与仪表板(例如 Grafana、Datadog)集成以进行可视化。
要开始使用,生成一个 API 密钥。
Prometheus 端点 API,用于检索 ClickHouse Cloud 指标
API 参考
| 方法 | 路径 |
|---|---|
| GET | https://api.clickhouse.cloud/v1/organizations/:organizationId/services/:serviceId/prometheus |
请求参数
| 名称 | 类型 |
|---|---|
| Organization ID | uuid |
| Service ID | uuid |
身份验证
使用您的 ClickHouse Cloud API 密钥进行基本身份验证
Username: <KEY_ID>
Password: <KEY_SECRET>
Example request
export KEY_SECRET=<key_secret>
export KEY_ID=<key_id>
export ORG_ID=<org_id>
export SERVICE_ID=<service_id>
curl --silent --user $KEY_ID:$KEY_SECRET https://api.clickhouse.cloud/v1/organizations/$ORG_ID/services/$SERVICE_ID/prometheus
示例响应
# HELP ClickHouse_ServiceInfo Information about service, including cluster status and ClickHouse version
# TYPE ClickHouse_ServiceInfo untyped
ClickHouse_ServiceInfo{clickhouse_org="c2ba4799-a76e-456f-a71a-b021b1fafe60",clickhouse_service="12f4a114-9746-4a75-9ce5-161ec3a73c4c",clickhouse_service_name="test service",clickhouse_cluster_status="running",clickhouse_version="24.5",scrape="full"} 1

# HELP ClickHouseProfileEvents_Query Number of queries to be interpreted and potentially executed. Does not include queries that failed to parse or were rejected due to AST size limits, quota limits or limits on the number of simultaneously running queries. May include internal queries initiated by ClickHouse itself. Does not count subqueries.
# TYPE ClickHouseProfileEvents_Query counter
ClickHouseProfileEvents_Query{clickhouse_org="c2ba4799-a76e-456f-a71a-b021b1fafe60",clickhouse_service="12f4a114-9746-4a75-9ce5-161ec3a73c4c",clickhouse_service_name="test service",hostname="c-cream-ma-20-server-3vd2ehh-0",instance="c-cream-ma-20-server-3vd2ehh-0",table="system.events"} 6

# HELP ClickHouseProfileEvents_QueriesWithSubqueries Count queries with all subqueries
# TYPE ClickHouseProfileEvents_QueriesWithSubqueries counter
ClickHouseProfileEvents_QueriesWithSubqueries{clickhouse_org="c2ba4799-a76e-456f-a71a-b021b1fafe60",clickhouse_service="12f4a114-9746-4a75-9ce5-161ec3a73c4c",clickhouse_service_name="test service",hostname="c-cream-ma-20-server-3vd2ehh-0",instance="c-cream-ma-20-server-3vd2ehh-0",table="system.events"} 230

# HELP ClickHouseProfileEvents_SelectQueriesWithSubqueries Count SELECT queries with all subqueries
# TYPE ClickHouseProfileEvents_SelectQueriesWithSubqueries counter
ClickHouseProfileEvents_SelectQueriesWithSubqueries{clickhouse_org="c2ba4799-a76e-456f-a71a-b021b1fafe60",clickhouse_service="12f4a114-9746-4a75-9ce5-161ec3a73c4c",clickhouse_service_name="test service",hostname="c-cream-ma-20-server-3vd2ehh-0",instance="c-cream-ma-20-server-3vd2ehh-0",table="system.events"} 224

# HELP ClickHouseProfileEvents_FileOpen Number of files opened.
# TYPE ClickHouseProfileEvents_FileOpen counter
ClickHouseProfileEvents_FileOpen{clickhouse_org="c2ba4799-a76e-456f-a71a-b021b1fafe60",clickhouse_service="12f4a114-9746-4a75-9ce5-161ec3a73c4c",clickhouse_service_name="test service",hostname="c-cream-ma-20-server-3vd2ehh-0",instance="c-cream-ma-20-server-3vd2ehh-0",table="system.events"} 4157

# HELP ClickHouseProfileEvents_Seek Number of times the 'lseek' function was called.
# TYPE ClickHouseProfileEvents_Seek counter
ClickHouseProfileEvents_Seek{clickhouse_org="c2ba4799-a76e-456f-a71a-b021b1fafe60",clickhouse_service="12f4a114-9746-4a75-9ce5-161ec3a73c4c",clickhouse_service_name="test service",hostname="c-cream-ma-20-server-3vd2ehh-0",instance="c-cream-ma-20-server-3vd2ehh-0",table="system.events"} 1840
指标标签
所有指标都具有以下标签
| 标签 | 描述 |
|---|---|
| clickhouse_org | Organization ID |
| clickhouse_service | Service ID |
| clickhouse_service_name | 服务名称 |
信息指标
ClickHouse Cloud 提供了一个特殊的指标 ClickHouse_ServiceInfo,这是一个 gauge,其值始终为 1。此指标包含所有指标标签以及以下标签
| 标签 | 描述 |
|---|---|
| clickhouse_cluster_status | 服务状态。可能是以下状态之一:[awaking | running | degraded | idle | stopped] |
| clickhouse_version | 服务正在运行的 ClickHouse 服务器版本 |
| scrape | 指示上次抓取的状态。可能是 full 或 partial |
| full | 指示上次指标抓取期间没有错误 |
| partial | 指示上次指标抓取期间存在一些错误,并且仅返回了 ClickHouse_ServiceInfo 指标。 |
检索指标的请求不会恢复空闲服务。如果服务处于 idle 状态,则只会返回 ClickHouse_ServiceInfo 指标。
配置 Prometheus
Prometheus 服务器以给定的时间间隔从配置的目标收集指标。以下是 Prometheus 服务器使用 ClickHouse Cloud Prometheus 端点的示例配置
global:
  scrape_interval: 15s

scrape_configs:
  - job_name: "prometheus"
    static_configs:
    - targets: ["localhost:9090"]
  - job_name: "clickhouse"
    static_configs:
      - targets: ["api.clickhouse.cloud"]
    scheme: https
    metrics_path: "/v1/organizations/<ORG_ID>/services/<SERVICE_ID>/prometheus"
    basic_auth:
      username: <KEY_ID>
      password: <KEY_SECRET>
    honor_labels: true
请注意,需要将 honor_labels 配置参数设置为 true,以便正确填充实例标签。
与 Grafana 集成
用户有两种主要方式与 Grafana 集成
- 指标端点 – 此方法的优点是不需要任何额外的组件或基础设施。此产品仅限于 Grafana Cloud,并且只需要 ClickHouse Cloud Prometheus 端点 URL 和凭据。
- Grafana Alloy - Grafana Alloy 是 OpenTelemetry (OTel) Collector 的供应商中立发行版,取代了 Grafana Agent。它可以用作抓取器,可以部署在您自己的基础设施中,并且与任何 Prometheus 端点兼容。
我们在下面提供了关于使用这些选项的说明,重点介绍了特定于 ClickHouse Cloud Prometheus 端点的详细信息。
使用指标端点的 Grafana Cloud
- 登录到您的 Grafana Cloud 帐户
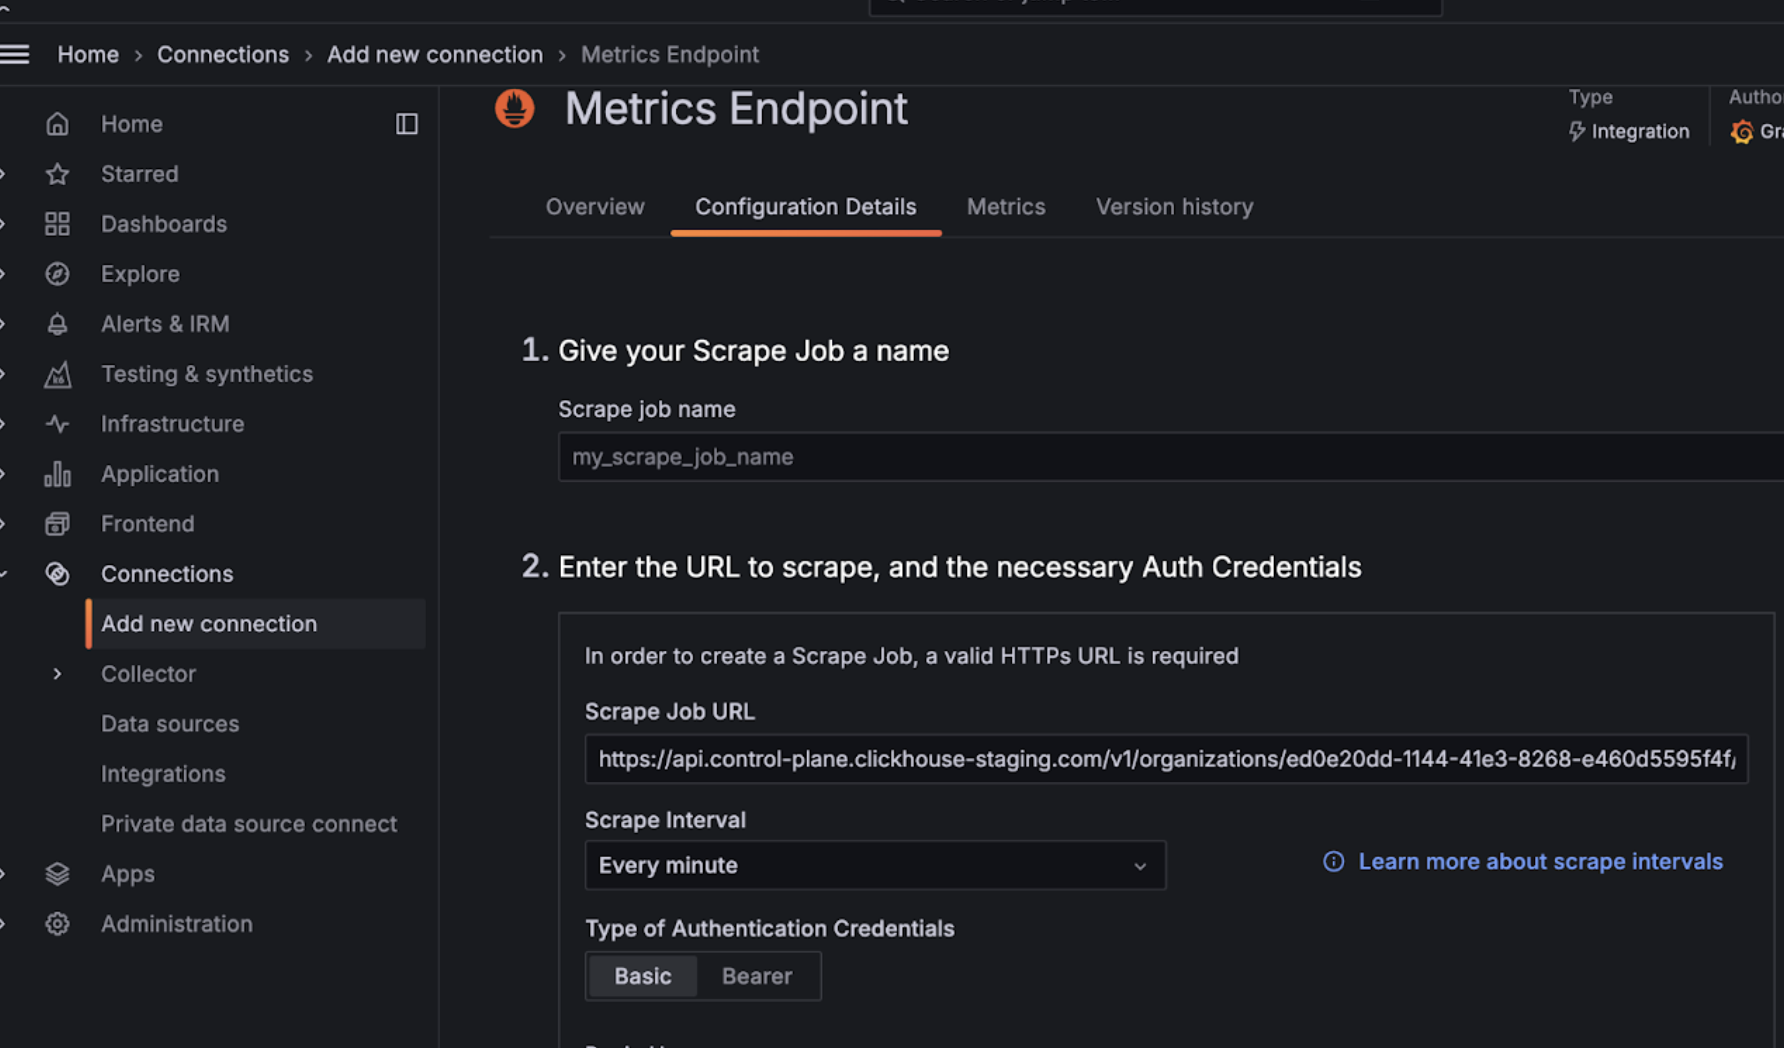
- 通过选择指标端点添加新连接
- 配置抓取 URL 以指向 Prometheus 端点,并使用基本身份验证来配置与 API 密钥/密钥的连接
- 测试连接以确保您能够连接
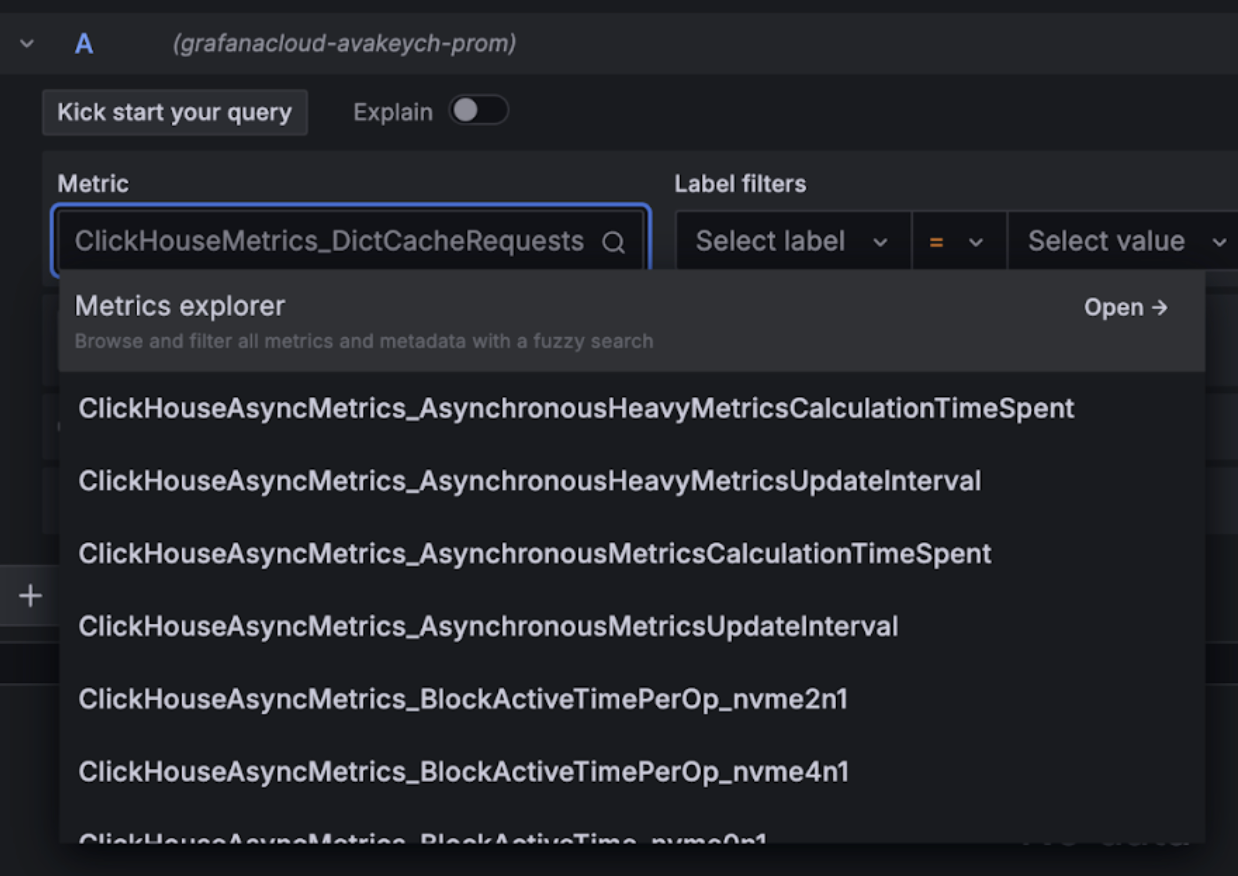
配置完成后,您应该在下拉列表中看到可以用来配置仪表板的指标
使用 Alloy 的 Grafana Cloud
如果您使用的是 Grafana Cloud,则可以通过导航到 Grafana 中的 Alloy 菜单并按照屏幕上的说明安装 Alloy
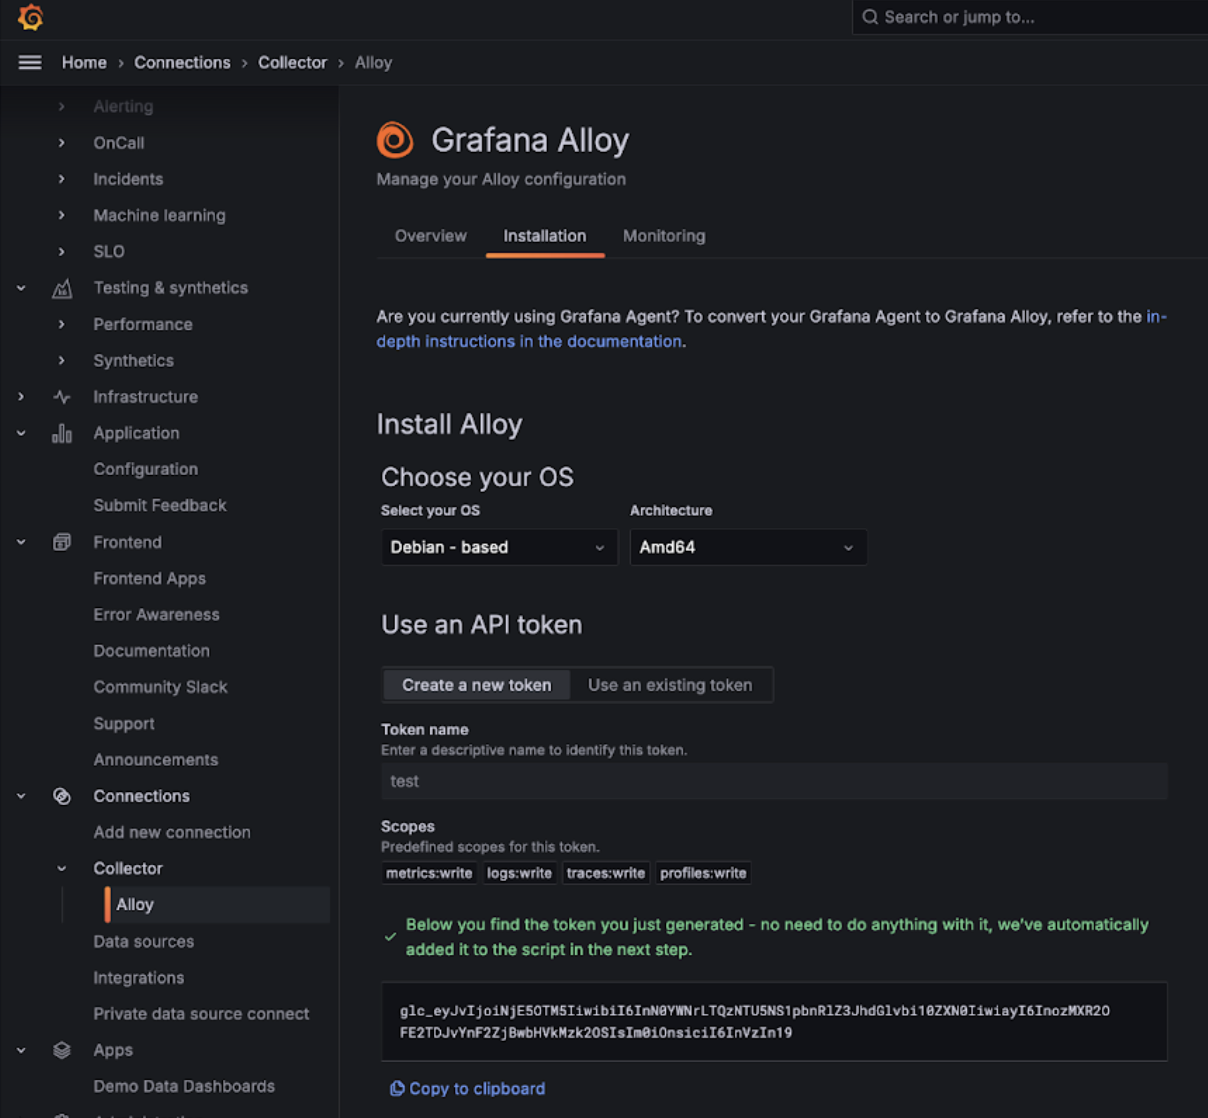
这应该将 Alloy 配置为带有 prometheus.remote_write 组件,用于将数据发送到带有身份验证令牌的 Grafana Cloud 端点。然后,用户只需要修改 Alloy 配置(Linux 下位于 /etc/alloy/config.alloy 中),以包含 ClickHouse Cloud Prometheus 端点的抓取器。
以下显示了 Alloy 的示例配置,其中包含用于从 ClickHouse Cloud 端点抓取指标的 prometheus.scrape 组件,以及自动配置的 prometheus.remote_write 组件。请注意,basic_auth 配置组件包含我们的 Cloud API 密钥 ID 和密钥,分别作为用户名和密码。
prometheus.scrape "clickhouse_cloud" {
  // Collect metrics from the default listen address.
  targets = [{
	__address__ = "https://api.clickhouse.cloud/v1/organizations/:organizationId/services/:serviceId/Promethues",
// e.g. https://api.clickhouse.cloud/v1/organizations/97a33bdb-4db3-4067-b14f-ce40f621aae1/services/f7fefb6e-41a5-48fa-9f5f-deaaa442d5d8/prometheus
  }]

  honor_labels = true

  basic_auth {
  	username = "KEY_ID"
  	password = "KEY_SECRET"
  }

  forward_to = [prometheus.remote_write.metrics_service.receiver]
  // forward to metrics_service below
}

prometheus.remote_write "metrics_service" {
  endpoint {
	url = "https://prometheus-prod-10-prod-us-central-0.grafana.net/api/prom/push"
	basic_auth {
  	  username = "<Grafana API username>"
  	  password = "<grafana API token>"
    }
  }
}
请注意,需要将 honor_labels 配置参数设置为 true,以便正确填充实例标签。
使用 Alloy 的 Grafana 自托管
Grafana 的自托管用户可以在此处找到安装 Alloy Agent 的说明。我们假设用户已配置 Alloy 以将 Prometheus 指标发送到他们期望的目标。下面的 prometheus.scrape 组件使 Alloy 抓取 ClickHouse Cloud 端点。我们假设 prometheus.remote_write 接收抓取的指标。如果目标目的地不存在,请调整 forward_to key。
prometheus.scrape "clickhouse_cloud" {
  // Collect metrics from the default listen address.
  targets = [{
	__address__ = "https://api.clickhouse.cloud/v1/organizations/:organizationId/services/:serviceId/Promethues",
// e.g. https://api.clickhouse.cloud/v1/organizations/97a33bdb-4db3-4067-b14f-ce40f621aae1/services/f7fefb6e-41a5-48fa-9f5f-deaaa442d5d8/prometheus
  }]

  honor_labels = true

  basic_auth {
  	username = "KEY_ID"
  	password = "KEY_SECRET"
  }

  forward_to = [prometheus.remote_write.metrics_service.receiver]
  // forward to metrics_service. Modify to your preferred receiver
}
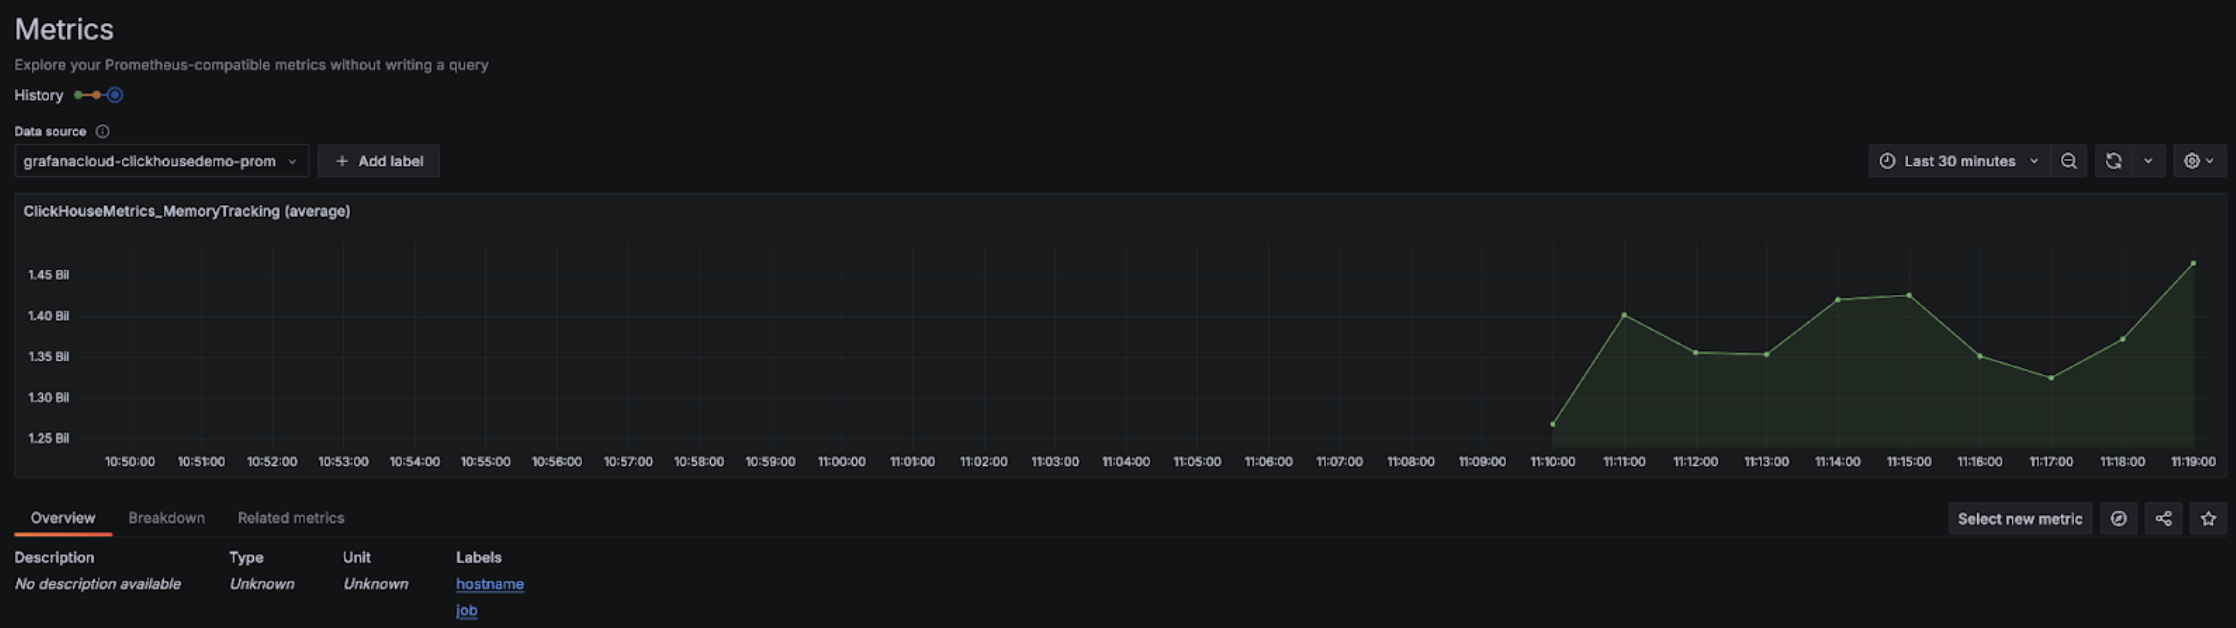
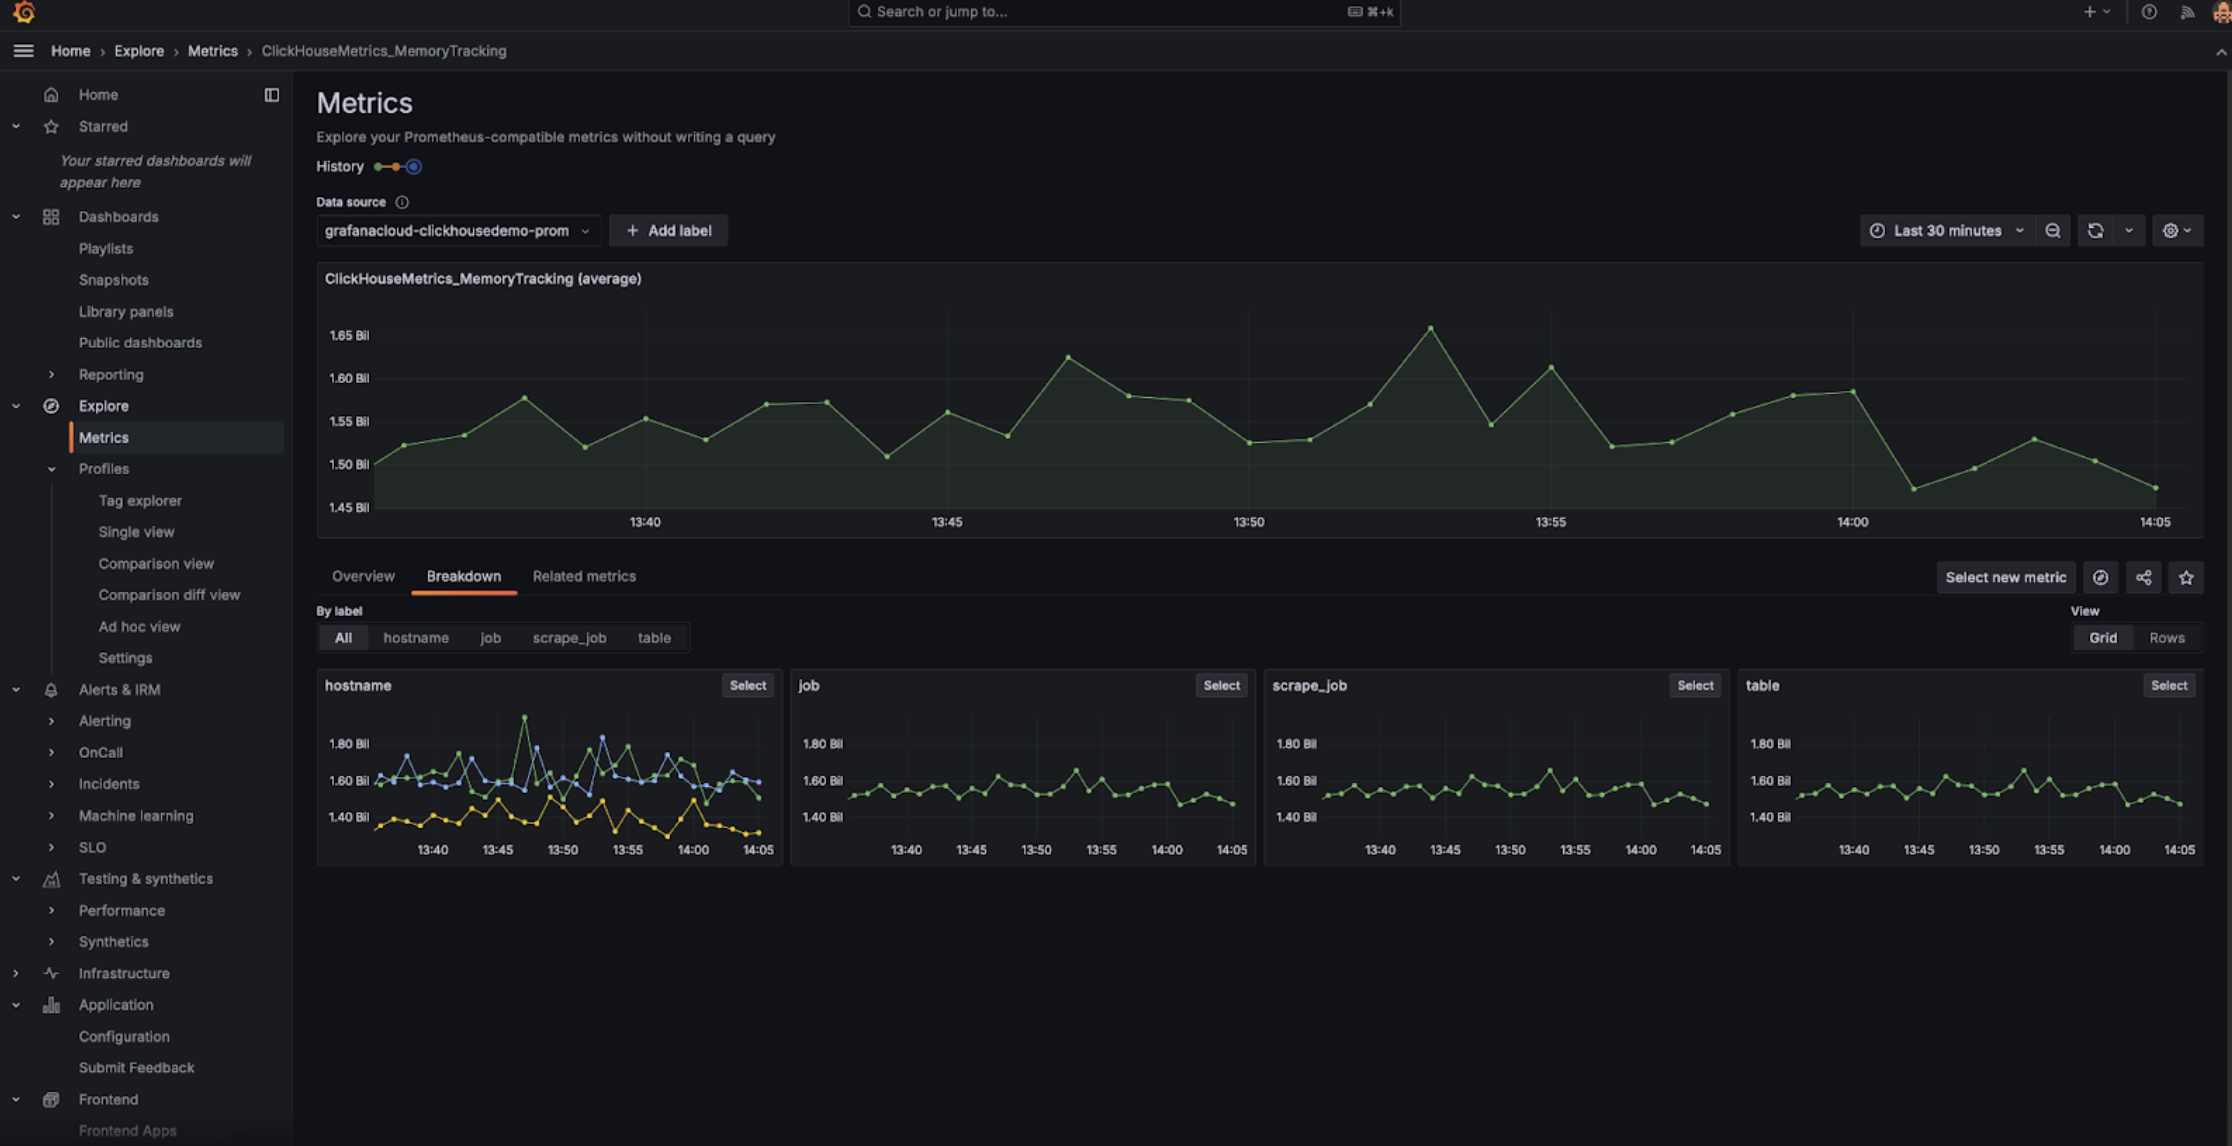
配置完成后,您应该在指标浏览器中看到与 ClickHouse 相关的指标
请注意,需要将 honor_labels 配置参数设置为 true,以便正确填充实例标签。
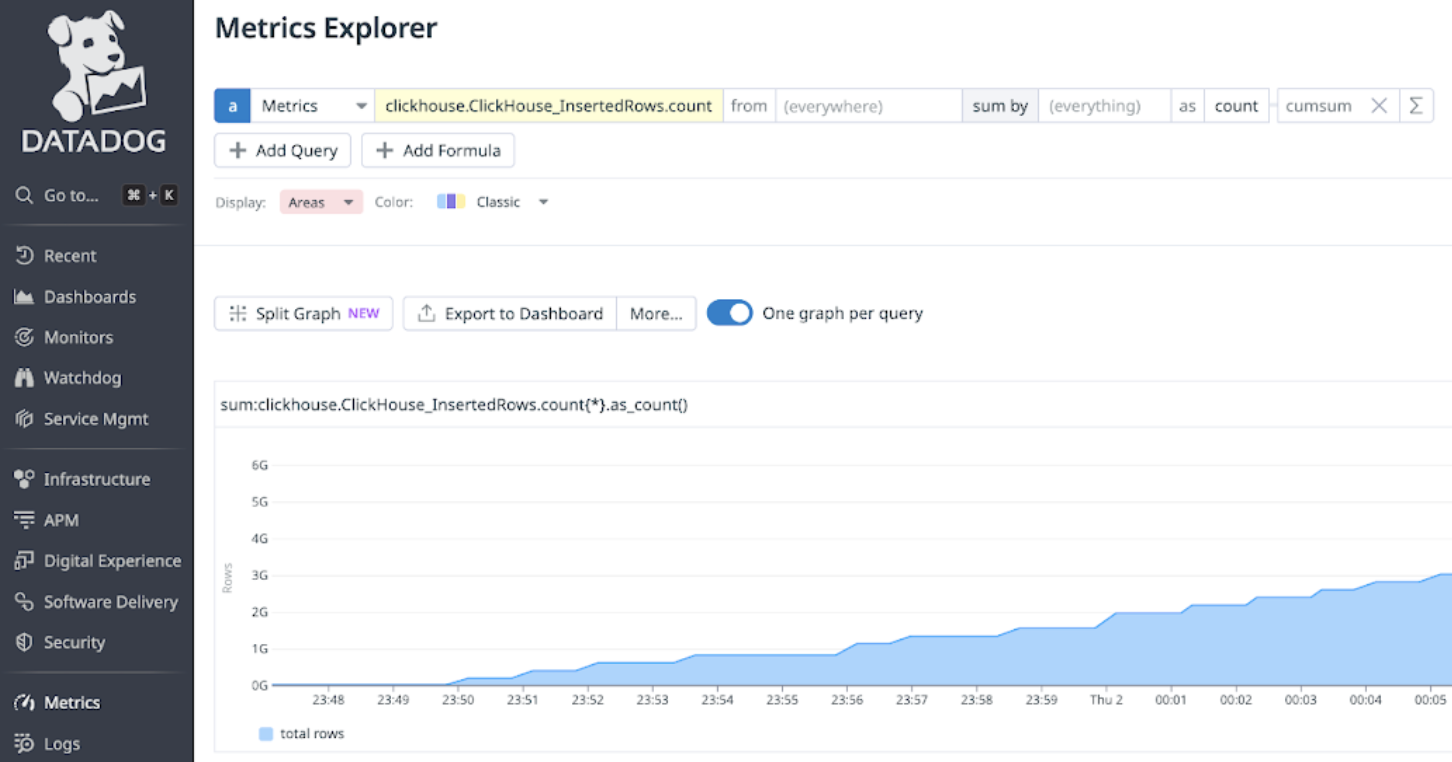
与 Datadog 集成
您可以使用 Datadog Agent 和 OpenMetrics 集成 从 ClickHouse Cloud 端点收集指标。以下是此 Agent 和集成的简单示例配置。但请注意,您可能只想选择您最关心的那些指标。下面的全选示例将导出数千个指标实例组合,Datadog 会将其视为自定义指标。
init_config:

instances:
   - openmetrics_endpoint: 'https://api.clickhouse.cloud/v1/organizations/97a33bdb-4db3-4067-b14f-ce40f621aae1/services/f7fefb6e-41a5-48fa-9f5f-deaaa442d5d8/prometheus'
     namespace: 'clickhouse'
     metrics:
         - '^ClickHouse.*'
     username: username
     password: password